Metabolic oscillations in yeast
Main | Dynamic data | Fluxes | Periodic fluxes | Metabolites | Metabolites in cell | Glucose drop | Harmonic rhythm | Model
Concentration data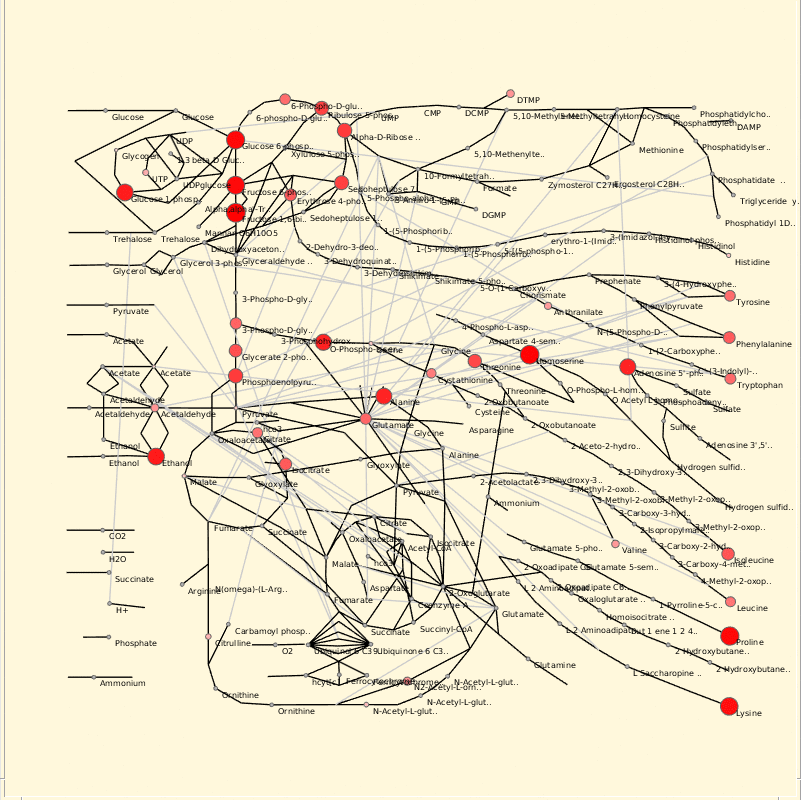
Each metabolite shown only once. |
Gene expression data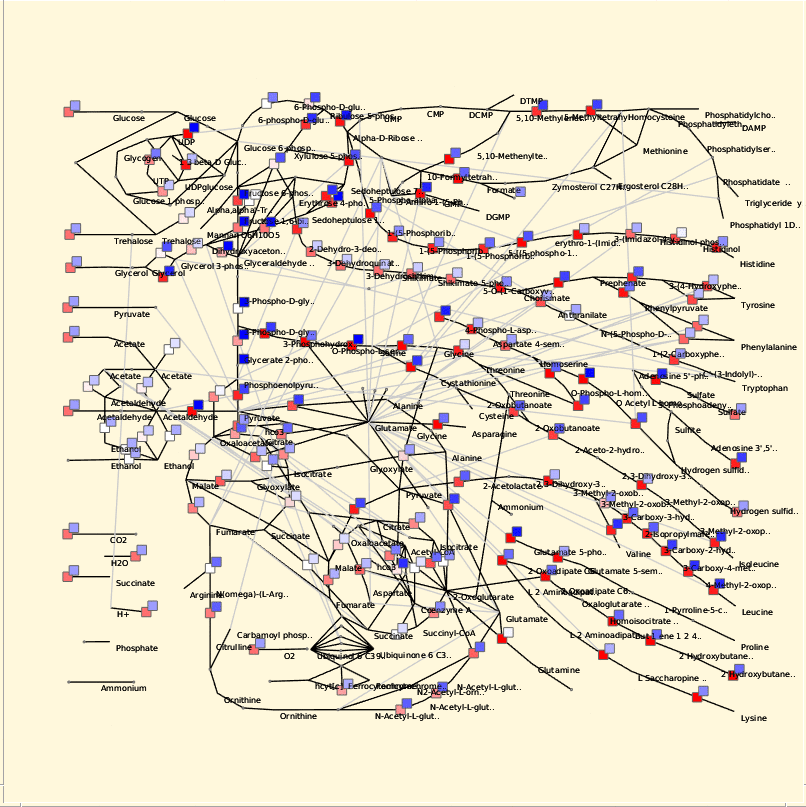
The color scale logarithmic is ranges from minimum (white) to maximum (dark color)
per reaction. |
References
- C.M. Li and R.R. Klevecz (2006). A rapid genome-scale response of the transcriptional oscillator to perturbation reveals a period-doubling path to phenotypic change. PNAS 103(44):16254.
- B.P. Tu, A. Kudlicki, M. Rowicka, and S.L. McKnight (2005) Logic of yeast metabolic cycle: {Temporal} compartmentalization of cellular processes, Science 310,1152.